Determination Of Amprenavir In Human Heparinized Plasma By Lc/ms/ms
Ronald E. Shoup, Yingjie Deng, Angela P. Johnson, and 1David M. Morris
BAS Analytics/Bioanalytical Systems, Inc. West Lafayette IN
1GlaxoWellcome, Research Triangle Park NC
Introduction
Amprenavir is a second generation human immunodeficiency viral protease inhibitor marketed as Agenerase by GlaxoWellcome under license from Vertex Pharmaceuticals. The drug has demonstrated both additive and synergistic pharmacological activity against HIV in combination therapies involving both protease and reverse transcriptase inhibitors. The goal of this work was to extend our current multi-PI/RTI bioanalytical LC/MS/MS assay to include amprenavir.
Amprenavir is weakly basic and has limited aqueous solubility. The structure is given in Figure 1. In order to extract it under conditions also suitable for the other PI's and RTI's listed in Table 1, a fairly general extraction scheme had to be considered, since ritonavir was not significantly retained using a mixed mode solid phase support. We wanted the extraction scheme for amprenavir to also be suitable for ritonavir, since ritonavir is commonly administered in cocktail therapy with many of the listed drugs to boost their bioavailability.
We opted for a simple solid phase extraction scheme based on hydrophobicity, using a C18 silica support, followed by selective LC/MS/MS separation and detection.
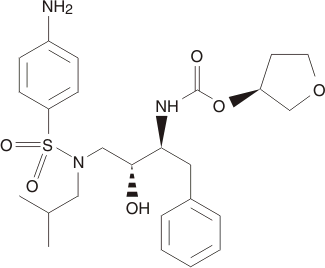
Figure 1. Structure of amprenavir (GI-268188)
Table 1. Protease and reverse transcriptase inhibitors and metabolites included in the assay
| Delavirdine | [Proprietary analyte] |
| Indinavir | Efavirenz |
| Saquinavir | Ritonavir |
| Nelfinavir | Lopinavir (ABT-378) |
| Nelfinavir M8 metabolite | Amprenavir |
Sample Preparation
100mg/1mL Varian C18 SPE columns were used on a Zymark RapidTrace system.
| Sample: | 100 µL plasma + 50 ng GI-268188C + 500 µL water |
| Condition SPE: | Ethyl acetate, methanol, water (2 mL each) |
| Load sample: | Entire mixture |
| Rinse SPE: | Phosphate buffer, water (2 mL, discard) |
| Dry SPE: | Nitrogen gas, 6 minutes |
| Elute SPE: | Ethyl acetate (3 mL, collect) |
|
Evaporate to dryness and reconstitute in 250 µL: |
35% acetonitrile containing 0.01% formic acid |
LC/MS/MS Conditions
|
LC separation column: |
Zorbax StableBond cyano, 100 x 2 mm |
| Mobile phase: | 46% methanol, 0.3% formic acid |
| Flow rate: | 500 µL/min |
| MS/MS: | MicroMass QuattroLC with Z-spray inlet |
| Mass transitions: |
Amprenavir: 506.3 > 245.4 13C6 internal standard: 512.3 > 245.4 |
| Source: | +ESI |
| Quantitation: | Peak area ratio |
| Collision cell: | Argon at 7.5 e-4 millibar |
Assay Validation
The method was validated according to GlaxoWellcome BioMet International Policy. There were 4 days of validation control sample precision and accuracy, these being established by running a freshly prepared curve along with replicates of control samples at the upper and lower limits of quantitation and at two intermediate concentrations. Stability testing, recovery, specificity, and dilution integrity were also evaluated.
Validation Control Sample Precision and Accuracy
|
Concentration
(ng/mL) |
Precision
(relative std. deviation, n≥6 ) |
Accuracy
(% of nominal, n≥6) |
||||||
| Batch run: | M00D | M01D | M02D | M03D | M00D | M01D | M02D | M03D |
| 10 (LLOQ) | 3.4% | 3.8% | 5.5% | 12.0% | 95.6% | 110.9% | 104.0% | 100.7% |
| 30 | 2.1% | 2.6% | 6.5% | 4.4% | 95.4% | 96.2% | 97.5% | 97.8% |
| 1500 | 2.2% | 2.0% | 3.7% | 2.4% | 101.9% | 101.5% | 98.9% | 103.5% |
| 2000 (ULOQ) | 1.4% | 2.3% | 2.0% | 2.9% | 97.3% | 96.7% | 98.7% | 101.7% |
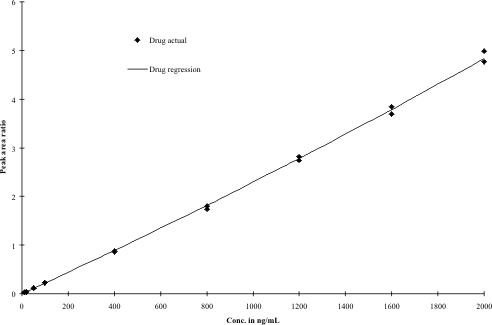
Typical chromatograms are presented in Figures 2 and 3 for the lower limit of quantitation, at 10 ng/mL, and a control (blank) plasma sample. Figure 4 describes typical calibration standard performance.
Figure 2. Chromatogram of Low Calibration Standard
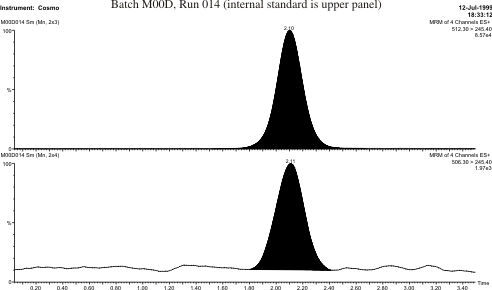
Figure 3. Chromatogram of Control (Blank) Plasma
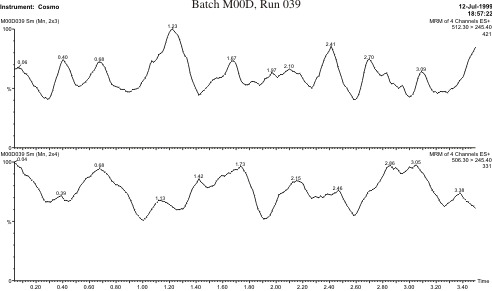
Figure 4. Calibration curve from batch run M00D
Stability Testing
Stability was assessed by subjecting validation control samples to test conditions and then assaying these samples in a batch run with a freshly prepared calibration curve and a reference set of validation control samples thawed only once.
Amprenavir was stable in heparinized human plasma under these conditions:
- For at least 3 freeze/thaw cycles (-20 °C ⇔ ambient)
- For at least 1.5 hr when heated to 56 °C
- For at least 48 hr in refrigerated plasma (2-8 °C)
- For at least 48 hr in plasma held at room temperature
- For at least 23 months at -20 °C
Amprenavir was also stable in these tests:
- In processed extracts of heparinized plasma for at least 48 hours
- In elution solution for at least 26 hours ("in process" stability test)
- In refrigerated standard solutions for at least 6 weeks
Assay selectivity
The method was tested for selectivity by the following:
- Blank plasma samples, with and without the M+6 internal standard. See Figure 3 for a double blank. The internal standard did not contribute a measurable response to the amprenavir signal.
- Plasma from 6 drug-naïve donors were tested to be blank for amprenavir.
- A 750 ng/mL amprenavir plasma pool was spiked to also contain 10 µg/mL each of indinavir, ritonavir, delavirdine, saquinavir, nelfinavir, and nelfinavir M8. The accuracy and precision were unaffected by the presence of the other compounds.
Dilution Integrity
A 3000 ng/mL validation control pool was diluted 2- and 100-fold with blank plasma, n = 6. The precision was 2.2% or less, and the accuracy ranged from 97.4- 108.3%.
Assay Performance
The method has been successfully applied to clinical trials involving combination therapies. Typical quality control and calibration standard precision and accuracy data obtained from a recent study are presented below:
|
Calibration Standards (n = 24-26):
|
|||||||||
| Nominal conc. | 2000 | 1600 | 1200 | 800 | 400 | 100 | 50.0 | 20.0 | 10.0 |
| Precision (%) | 3.4 | 3.9 | 2.7 | 3.5 | 3.7 | 2.8 | 4.9 | 6.9 | 7.2 |
| Accuracy (%) | 98.5 | 99.2 | 101.9 | 101.0 | 103.2 | 97.2 | 99.5 | 98.4 | 101.3 |
|
Quality Control Samples (n = 26):
|
|||
|
Nominal conc. |
1500 | 750 | 30 |
| Precision (%) | 4.4 | 4.3 | 4.8 |
| Accuracy (%) | 89.6 | 89.5 | 90.0 |
Discussion
We were able to add amprenavir to the 6-in-1 combination assay already developed1 for the PK monitoring of cocktail therapies employed in HIV treatment. Our extraction procedure remains basically the same for all ten analytes listed in Table 1. For optimum LC/MS/MS performance, three different instrument setups have been used. Efavirenz is measured by negative ion APCI but the others are all detected under positive ion electrospray conditions. In most of the cases, selection of the MS acquisition parameters differentiates one application of the method from the next.
Since the original validation, the method has also been established in the 96 well SPE format on Packard MultiProbe 204 and MultiProbe II platforms.
Conclusions
- A general purpose solid phase extraction procedure was employed to measure plasma concentrations of up to 10 HIV drugs commonly employed in combination therapies.
- The measurement of amprenavir was successfully added to the assay portfolio.
References
1. SIMULTANEOUS DETERMINATION OF SIX PROTEASE/REVERSE TRANSCRIPTASE INHIBITORS IN HUMAN PLASMA, UTILIZING LC/MS/MS.
R.E. Shoup*, X. Ren, A.P. Johnson, D. Gray, S. Everts, and B.D. Beato, 1998 AAPS Annual Meeting, San Francisco, CA.