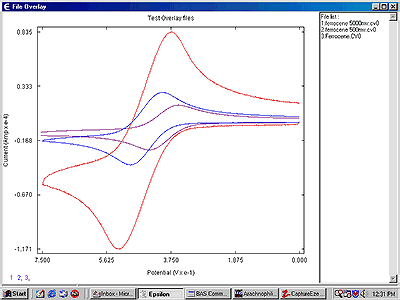
File Overlay
Up to ten data files can be superimposed on a single set of axes using the File Overlay function in the Graph-Display menu. Data files can be selected from different directories. Once the files have been loaded, the overlay file can be saved. However, in order to recall overlays, the original files must still be present in the same location. Files to be overlayed must also be stored on the hard drive, NOT on a floppy disk or CD.
The default axis scale is determined by the first file to be loaded (the base file). However, the axes scales can be manually frozen and a mouse-controlled zoom is also available. The base file also limits the types of data files that can be overlayed. The available graph types are current vs. potential, current vs. time, and potential vs. time. Any given overlay can only display data of one type; that is, current vs. time plots (from, e.g., chronoamperometry) cannot be overlaid with current vs. potential plots, but pulse voltammograms can be overlaid with cyclic voltammograms. Selecting a new graph type will clear all data files from the overlay.
The procedure for overlaying data files is as follows:
- Select File Overlay in the Graph-Display menu. The overlay window then appears (note that no non-overlay functions cannot be used while the overlay window is active). This window will display the previous overlay; if no overlay has been peformed since the program was started, the window will be empty.
- Right-click to access the pop-up menu, and click Setup. The File Overlay Setup
dialog box will appear (Fig1).

Figure 1. File Overlay Setup dialog box.
- The files listed are determined by the graph type (Current vs. Potential, Current vs. Time, or Potential vs. Time) and the specified technique. Note that the techniques listed depend on the selection of the graph type). Select the Base File name
and click New
to display this file (Fig2).

Figure 2. Base file loaded.
- Select the files to be overlaid (up to 9 may be selected), then click Add. The file names will be listed on the Added Files
list (Fig3), and the graph will be redrawn with the base file and added files (Fig4). Click Exit
to remove the dialog box.

Figure 3. Selection of added files.

Figure 4. Overlaid graph.
- To remove a file from the overlaid graph, select the relevant file name from the Added
Files list, and click Delete.
- Other options in the File Overlay Setup
dialog box are as follows (note that Apply
must be clicked in order to activate any changes in these functions):
- Title. A title can be entered for the overlaid graph.
- Symbol. If selected, a symbol will be used for the graphs instead of a line. The symbol will appear at every nth point, where n is the number entered in the adjacent box (default value = 20).
- B/W Graph Only. This will remove all colors for the graph (for printing and copying to the clipboard).
- Freeze. This function allows the user to set the maximum and minimum for each axis. If selected, the axes will remain frozen at the specified values even if a new base file is selected. When unchecked, the axes will revert to the values determined by the current base file. It should also be noted that the cursor zoom is disabled if Freeze is selected.
- The other functions in the pop-up menu are as follows:
- Save/Load. An overlaid graph can be saved. However, in order to recall (Load) overlays, the original files must still be present and in the same location.
- Grid. The graph can be plotted with a full grid (note that the zero-line axis option is not available for overlay graphs).
- Copy to Clipboard. This command transfers the data from the active experiment window (without the frame) to the clipboard, from which it can be transferred to other Windows programs.
- Zoom Out. This reverses the effects of any mouse zoom operations, and restores the default axis limits (note that this is disabled when the Freeze function is used).
- Text Info (Right Column). The text column to the right of the overlay graph can be removed.
